Cost Curves
- kissell
- Feb 15, 2024
- 1 min read
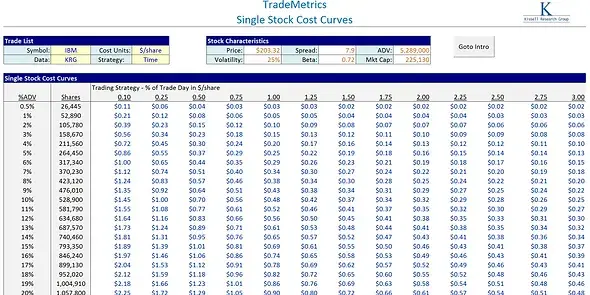
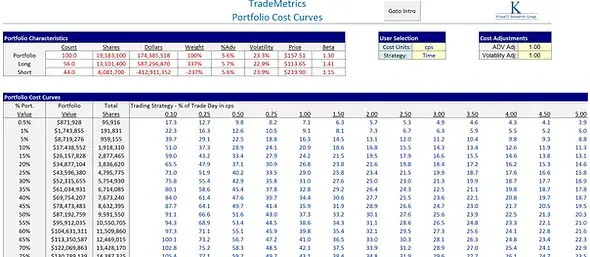
Cost Curves provide the expected trading cost for a various order sizes (%ADV) and trading strategy such as VWAP or a specified percentage of volume (POV rate). The more passive the strategy the lower the trading cost and the more aggressive the strategy the higher the trading cost.
These cost curves are being used by portfolio managers, analysts, and traders to construct portfolios, run optimization, evaluate trading performance, critique algorithms and algorithms, as well as for input into internal and proprietary trading models.
Cost Curves are available across the global markets for Stocks, ETFs, Futures, and multi-asset classes.
Regions covered include: US (LC & SC) Canada (LC & SC), Europe (Developed & Emerging), Asia (Developed & Emerging), Latin America, and Frontier Markets.
Cost Curves are available:
Real-Time
End of Day
Historical database


Comments